

Automating Adobe Analytics usage data in Analysis Workspace

Analytics on your Analytics users
Adobe Analytics gives you great data on how your customers are using your website, but what if you want to know about how your internal users are using Adobe Analytics?
A few years ago Adobe published a blog here on how to get data on your Adobe Analytics usage into Adobe Analytics as a data source. In a nutshell, it shows how you can export the usage logs out of Adobe Analytics, do a bunch of data wrangling, and then import it back into Adobe Analytics as a data source.
What’s it useful for?
Data on how your users are using Adobe Analytics can help justify your investment in Adobe Analytics (can you tell this part is copied from the Adobe blog), it can show the results of training sessions, and tell you who your power users are. You could answer business questions like:
- How many users are accessing Analytics over time?
- Are more users accessing Adobe after we delivered training sessions?
- Who are our power users?
- What are the most popular projects or segments?
- Who deleted my workspace?!
If you want more info on the sorts of things you can do with this data, go ahead and read the Adobe blog on the subject. It goes into much more detail than I will here.
Automating the process
So here is the interesting bit: The previous method was very manual and required that you do a lot of the data extraction, transforming, and enriching yourself. I’ve automated pretty much all of it.
I’ve recently been trying to increase my skills with Python and the Adobe APIs, to try and automate some of the more repetitive parts of my job. Like a lot of people, I’ve found in the last few months that ChatGPT (specifically GPT-4) has massively increased my ability to output working code. So I figured automating this process would be an excellent use case.
To that end, I’ve written a Python script that mostly automates the entire process outlined in Adobe’s blog. The code and a more detailed explanation of the script can be found in a public GitHub repository here: https://github.com/station-10/adobe-usage-import-manual
But here’s a brief summary of the process:
How it works
Connect to the Adobe APIs
You’ll need a developer account with access to the Adobe Developer Console for your organisation to create an API project with access to Analytics. More details on getting started with the APIs can be found here.
Downloading the data
The script will download the Adobe usage logs for a specific date range, from the Usage API Endpoint. That endpoint has an annoying 3 month limit on the date range for each call, so the function handles making multiple requests if you specify a longer date range.
Enriching the data
The usage log data comes out looking like this:
{
"eventType": 31,
"eventDescription": "Project Updated: Name=Marketing Channel TEST Project Id=64365d1e723ea728686e1970 Owner=Stephen Webb",
"ipAddress": "XX.XX.XXX.XXX",
"login": "steve.webb@station10.co.uk",
"rsid": "N/A",
"dateCreated": "2023-04-14T08:32:15.000+00:00"
},
There is some good information here, but we can do a couple of things to make the data even more useful for us:
- The
eventTypecan be converted to a friendly name. - We can pull information out of the
eventDescriptionfor easier reporting on things like categories of events (e.g. ‘Project Viewed’ in the example above), and component information. - We should definitely scrub the email address and remove the domain part of it.
- We can add event numbers for setting in
s.eventsand using for metrics in Analytics.
So after all that we end up with data that looks like this:
{
"eventType": "Workspace Project",
"eventDescription": "Project Updated: Name=Marketing Channel TEST Project Id=64365d1e723ea728686e1970 Owner=Stephen Webb",
"ipAddress": "XX.XX.XXX.XXX",
"login": "steve.webb",
"rsid": "N/A",
"dateCreated": "2023-04-14T08:32:15.000+00:00",
"event": "event3",
"componentName": "Marketing Channel Costs Project",
"componentId": "64365d1e723ea728686e1970",
"componentOwner": "Stephen Webb"
},
The benefit of doing all this now, is that we can avoid having to set up Processing Rules and regex Classifications in the Adobe interface, as the original blog suggests.
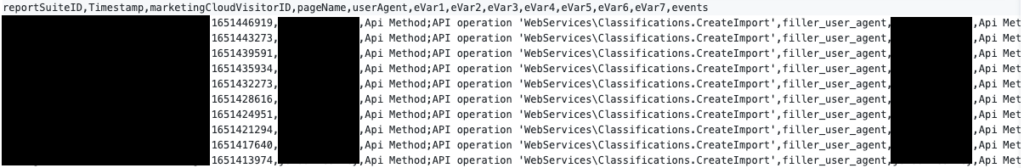
Converting to CSV
We then need to convert it to a CSV file for importing via the Bulk Data Insertion endpoint. At this point we need to add a few mandatory fields:
- reportSuiteID
- Timestamp
- marketingCloudVisitorID
- s.pageName
- userAgent
And we end up with a .csv file that looks something like this:
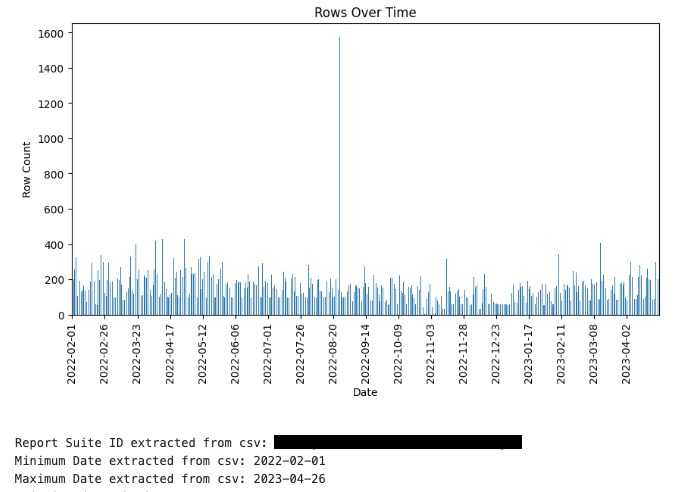
Data validation
Uploading data into Adobe Analytics is relatively straightforward, however, removing data is not. The Data Repair API exists but we really don’t want to have to use it, so we should be very careful with the data we want to upload.
With that in mind, we can do a couple of things:
Firstly, we can do a few checks on the data to ensure it looks like what we’re expecting. Things like graphing the data over time and confirming it starts and ends at the dates we expect:
Secondly, we can validate the .csv file against the Validation endpoint, and confirm we get a successful response:

Creating a report suite to put the data in
At this point we should create a report suite to put the data in. This is one part I haven’t yet automated but I plan to add that functionality in a future update, as creating 30+ events in the Adobe Admin UI is a chore. For now, check out the README file on GitHub for the evars and events that you’ll need to set up.
Inserting the data
Now we’re ready to insert the data. This is done using the Bulk Data Insertion Endpoint. Again, because I’m nervous about inserting data, this function performs a couple of checks:
- It includes a check against the validation endpoint mentioned above.
- It also performs a request to Adobe Analytics to check if there is any existing data in the date range of the .csv file. Just in case you accidentally try to upload data for the same date twice.
Provided both of those checks pass, it’ll upload the file. An hour or so later, you should see all your Adobe usage logs as data in Adobe Analytics!
Next Steps
I won’t talk too much about how to use the data in Workspace; Adobe’s blog already does a good job of that and I’m sure if you’ve read this far that you already know how to create a decent dashboard.
Otherwise my next plan for this would be to automate the process in an ongoing fashion. Currently this script will handle inserting all your historic data in one go, but you’ll need to re-run the script to insert new data as time goes on. The script does make that a super easy process, but why click a few buttons every week when you could automate it completely?
Hope this is useful to someone, if you have any questions or comments, please reach out to me at steve.webb@station10.co.uk. Or if Python isn’t your thing and you’re interested in us setting this up for you, reach out to steve.garrett@station10.co.uk 🙂
Useful Links
Original Adobe Blog: https://express.adobe.com/page/hnYfQPThMu2dr/
Usage API Endpoint: https://developer.adobe.com/analytics-apis/docs/2.0/guides/endpoints/usage/
Bulk Data Insertion API Endpoint: https://developer.adobe.com/analytics-apis/docs/2.0/guides/endpoints/bulk-data-insertion/