

Adobe Plus Excel: Speed Up Your A/B Test Reporting


Adobe Target enables organisations to deliver A/B tests and personalisation to their website or app visitors. By testing out different user journeys, features and content to segments of your audience, you can determine which experience performs best in terms of conversion or engagement.
Adobe Target has an out-of-the box integration with Adobe Analytics, meaning there is a single source of truth for reporting on A/B test performance. There is no need to set up metrics from scratch before the test, or know in advance what you want to report on afterwards. It’s all there waiting for you in Workspace!
We’re going to talk about combining Adobe Analytics data (using the Excel plug-in Adobe Report Builder) with Adobe Target’s sample size calculator and confidence calculations in Excel, to make interpreting A/B test results quicker and easier.
Caveat: There will be more sophisticated (and scalable) methods and tools out there – we’ve picked Excel as it’s commonly used and accessible to most!
Adobe Analytics and Sample Size
The out-of-the-box integration between Adobe Analytics and Adobe Target allows you to view the difference in success metrics between the test experiences and the associated confidence levels. For example, a change in user journey might result in an increase in order conversion of 3%, with a confidence level of 96%. Best practice is to look for a confidence level (probability that the result isn’t due to chance) of 95%.
However, when reporting on an A/B test result, it’s important to take into account not only the confidence level, but also whether there is enough data to confirm that the result is statistically significant. This is called checking the sample size. Unfortunately, the ability to check the sample size isn’t present in Adobe Analytics itself.
Adobe provide a sample size calculator that can be used before a test goes live to estimate how long it will need to run (i.e. how much traffic is needed to detect a certain size of uplift).
When reviewing test results and finding a confidence level at or above 95%, it can be tempting to conclude the test there and then. Don’t do it! You need to check that you’ve gathered enough data to conclude that the result is statistically significant. This is where the sample size calculator comes back in.
Extending Capabilities with Excel
One way to speed up the process of checking A/B test results is to recreate both the sample size and confidence calculations in one Excel file. The Adobe Report Builder Excel plug-in can be used to pull test data directly from Adobe Analytics into Excel automatically, on a scheduled basis (e.g. every week).
A caveat to this Excel solution is that it focuses on binary conversion metrics; for example, Visitors with Orders divided by Visitors. It is important to note that these have difference confidence calculations to the metrics in Adobe Analytics for Target (A4T) panels, as these treat all metrics as continuous variables; for example, Orders divided by Visitors. Confidence calculations for continuous metrics require visitor-level data exports, which we will cover another time!
The benefits of using this approach are:
- you can review confidence levels and sample size in one centralised place to check statistical significance, instead of switching between tools
- binary metrics require less time to reach statistical confidence. For example, a continuous metric like Revenue per Visitor can take 20-30% longer than a binary conversion rate to reach statistical confidence.
- you can make use of the flexibility of Excel in the look and feel of your report.
Integration in Action: Faster Insights To Your Inbox
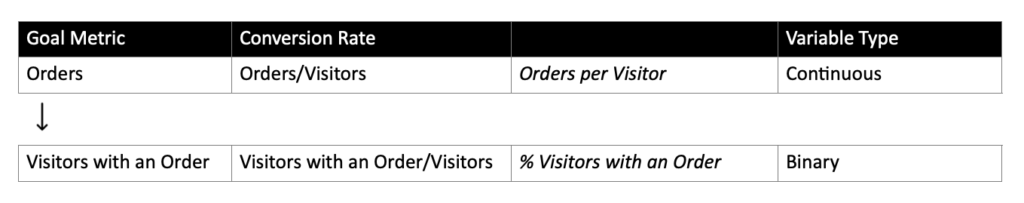
1. Define your (binary) metrics
Define what your binary metrics are. If you’re used to Analytics for Target, you’ll be familiar with selecting success metrics such as Orders, Checkouts or Registrations. Reframe these into visitor-level metrics like Visitors with Orders, Visitors with Checkouts or Visitors with Registrations. This changes your continuous metrics to binary metrics.
Example:
2. Pull the Adobe Analytics test data into Excel
Using Adobe Report Builder, pull your test data into Excel. You will need to spend time to structure your report in the right way bearing in mind Report Builder’s limitations, such as only being able to pull in two dimensions per report. Segments can be used to get around this. Also, consider that not all calculated metrics will be compatible with Report Builder as they may require fully processed data. This is where the bulk of your time may be spent, but once created, you should be able to use the same template over and over.
3. Add the sample size and confidence calculations
You can find the sample size calculations in this Adobe forum, and the Adobe Target Confidence Calculator here. In the Excel file, link together the Adobe Analytics test data with the sample size and the confidence calculations – the combination of these will allow you to report on whether statistical significance has been reached. You should be able to check both the confidence level and the sample size for each metric in a simple click, and get a simple ‘significant’ or ‘not significant’ result. It is also easy to schedule the report directly to your inbox.
Conclusion
Combining Adobe Analytics A/B test data with sample size calculations in Excel results in a quicker and easier reporting process for binary metrics. Avoid switching between tools and centralise your reporting and calculations.
As mentioned at the beginning of this post, Excel is just one of the tools that could be used for this particular analysis. If you have Adobe data integrated into other platforms with the flexibility to perform calculations, the same methodology can be applied elsewhere.
The natural next step is to consider continuous variable reporting, such as Revenue per Visitor. For this, a more sophisticated solution is required that can handle visitor-level data exports. More on this another time…
P.S. Adobe forums suggest that a new version of Report Builder will exist with Customer Journey Analytics, Adobe’s next-generation Analytics solution. We look forward to seeing that!
Calculating sample size and significance correctly are crucial to A/B test success. This topic is included in our booster programmes for data-driven Conversion Rate Optimisation. If you want to find out more, please reach out.